多伦多地产局 (TRREB) 发布表示,2025年1月,房屋销量同比下降7.9%,录得3,847宗交易。各类房屋平均售价为1,040,994加元,比2024年2月增长1.5%。
在地产局报告发布半个月后,51找房独家发布2025年2月上半月统计数据。
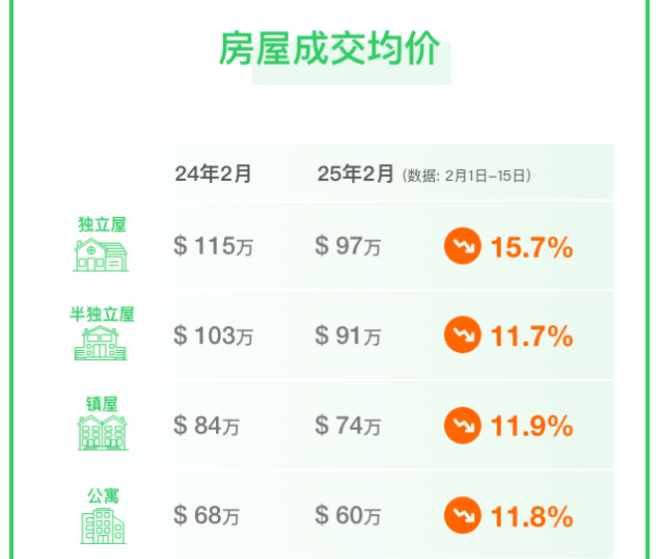
数据显示,截至2月15日,大多伦多地区所有类型房屋房价均下跌,其中独立屋平均价同比下跌最多,达到15.7%,从去年2月的平均价115万跌至今年2月的97万,净跌18万;公寓净跌8万,跌幅达11.8%;镇屋净跌10万,跌幅达11.9%;半独立屋净跌12万,跌幅11.7%。
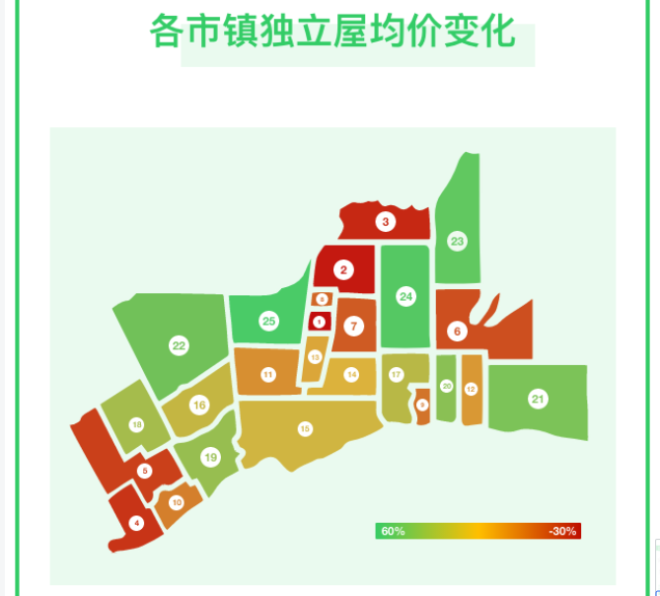
其中华人聚居的万锦市独立屋2月上半月均价178万元,比去年同期的181万下跌1.66%,净跌3万。Aurora则登上跌幅榜第一名,2月上半月均价126万元,比去年同期的173万下跌27.17%,净跌47万。
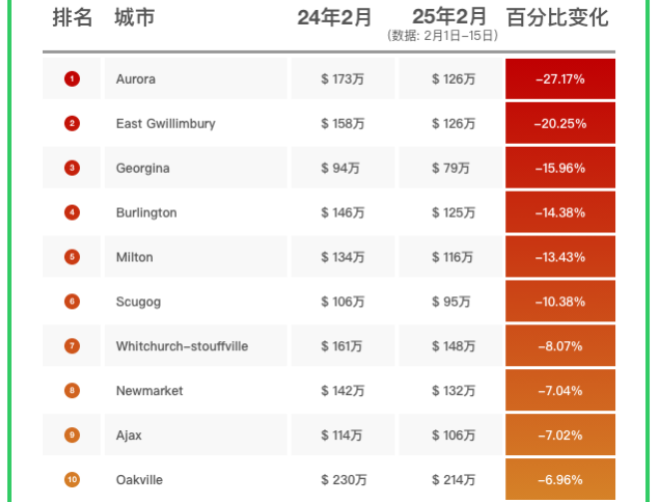
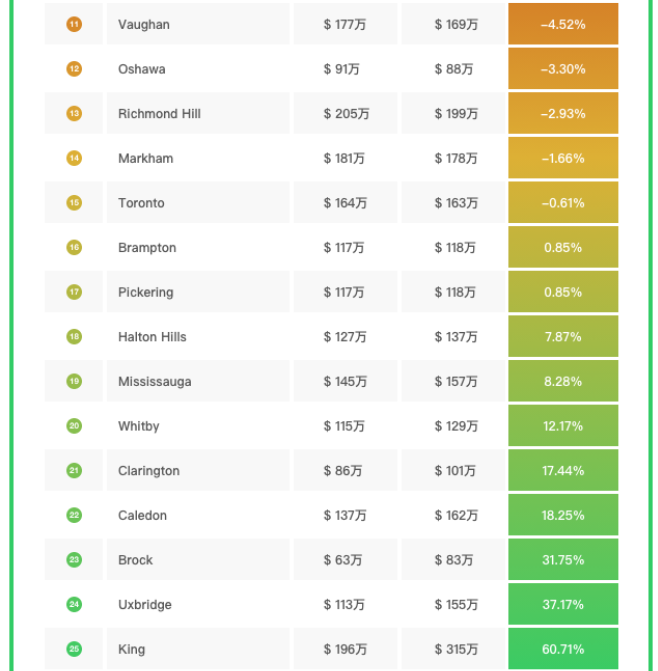
位居跌幅榜第二名的是East Gwilimbury从去年2月的158万狂跌到126万,跌幅高达20.25%,紧随其后的是Georgina,跌幅高达15.96%。

位居涨幅榜第一名的是King,涨幅60.71%。紧随其后的是Uxbridge和Brock,涨幅均超过30%。
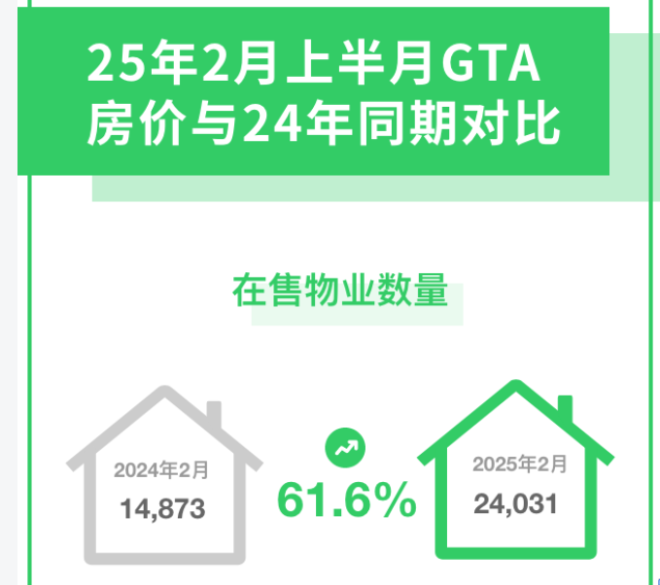
根据51找房统计数据显示,2月上半月大多伦多在售物业数量20031套,比去年同期的14873套增加61.6%。
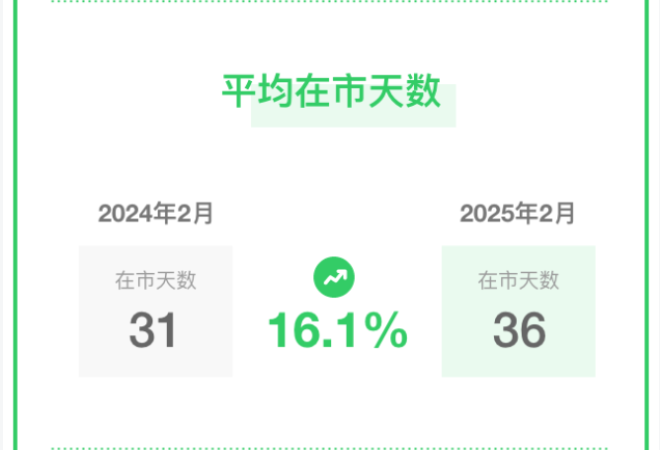
平均在市天数为36天,去年同期是31天。